It’s no secret that application environments are certainly not getting any simpler.
From the complexity of the mix of applications to manage (there is indeed an app for everything!) to the complexity of building and deploying those apps (microservices, containers and the burgeoning DevOps/cloud-native ecosystem) to the complexity of the delivery infrastructure (mobile, virtual, cloud, SaaS), IT is faced with more apps, systems and platforms than ever to keep up and running in peak condition.
With greater complexity driving the need for greater visibility, the processes, tools and methods of monitoring are also growing ever more diverse. One of the ways in which this is happening is through the DevOpsification of monitoring a.k.a. observability.
What is observability?
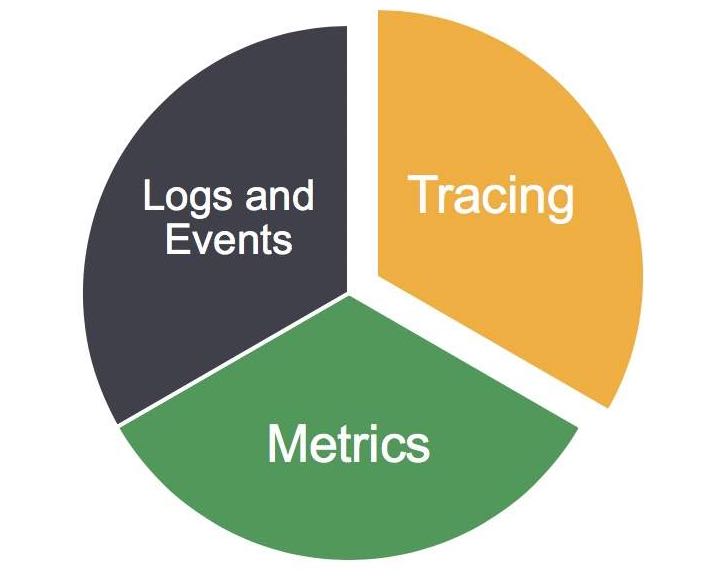
Observability data types
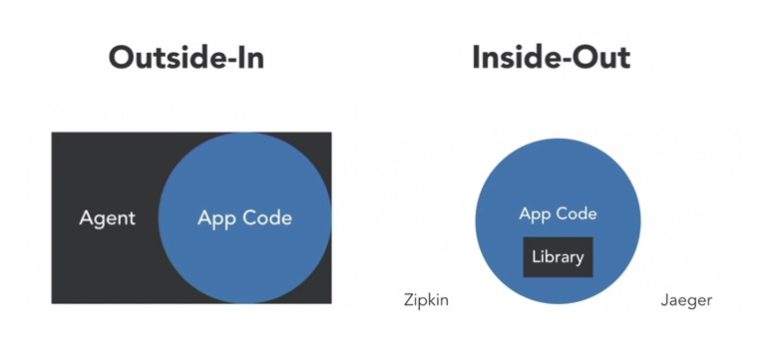
Traditionally, monitoring has been the domain of ops—sort of an outside looking in view for someone who doesn’t actually build the code. Observability, as a culture and practice, represents a shift left for monitoring as developers take on the task of building applications able to externalize their internal state. A number of open-source technologies have made this inside-out view possible, including:
- collectd—application metrics
- statsd—application statistics
- fluentd—unified log data collection
- Zipkin, Jaeger, OpenTracing/OpenTelemetry—distributed tracing systems and standards supporting polyglot languages like Go, PHP, Python, C/C++
- Semantic logging—structured logs based on strongly typed events
Monitoring vs observability: a false dichotomy
Monitoring and observability have different purposes. Monitoring aims to provide a broad view of anything that can be generically measured based on what you can specify in external configuration, whether it is time-series metrics or call stack execution. However, it lacks information as to the developer’s intent. Observability is built into the code by that very developer to provide insight into the system based on the intended behavior. Systems that incorporate observability can be effectively debugged with context rather than conjecture.
However, observability does not scale the way monitoring can. Spans are configured while writing code, and for it to be failsafe would require the developer to mark up every span of interest—and a developer is only human! Monitoring, on the other hand, will simply capture every single method call and parameter (or whatever you specify based on runtime characteristics).
Cloud native adoption
Observability, along with cloud-native development, has become a cornerstone of modern application and systems design, and a wide variety of open-source monitoring, search, analytics, and visualization platforms have emerged to consume these new data sources. You’ve probably heard of Prometheus, Elastic, Grafana, etc. A quick glance at the CNCF landscape illustrates the sheer number of options. The free availability of these options has resulted in widespread adoption among developers and DevOps teams.
Concurrently, there has been a staggering increase in the amount of data generated by modern apps. Last year’s DEJ study noted an 18x increase in data collected, on average, from monitoring components and dependencies in container-based vs. more traditional monolith environments. And not only has there been an explosion in the volume and velocity of data, but the variety of data types and sources continues to grow as well.
This has created a fresh set of problems.
More data, more problems
While having all this data empowers developers to shift left and fix bugs early in the app lifecycle, relying on multiple commercial and open-source tools is impractical for production environments where there is greater urgency to respond to user issues fast and fix them before business is impacted. Manually correlating data across disparate tools and silos to isolate and triage a user issue is slow and near impossible unless you already know what you are looking for. And while many of the free and low-cost options may appear attractive at first, it quickly becomes apparent they cannot scale in enterprise environments where there may be as many as tens of thousands of containerized components to track and monitor, and where the number of executed transactions can number in the billions every day.
As a result, forward-looking organizations recognize a strong need for:
- Unified visibility across multiple IT functions, including app, network and cloud infrastructure
- Big data technology capable of capturing, streaming and storing the volume, velocity and variety of data without undue stress on the underlying system or storage infrastructure
- AIOps approaches for analyzing and visualizing the resulting big data to extract meaningful, even predictive, information about the IT environment
This is where an enterprise-scale monitoring solution providing a single-pane-of-glass view can be immensely valuable.
Better together
Combining application performance monitoring (APM) with observability data, you can have the best of both worlds: insight into the intent of the code, as well as complete end-to-end traces and transaction flow mapping, unified views and drill-downs across multiple IT functions, all with rich metadata context.
 By Amena Siddiqi
Published with permission from Riverbed.